
Profiling
It all started with Brendan Gregg’s blog: http://dtrace.org/blogs/brendan/2011/12/16/flame-graphs/ and a few hours later the “stack monitor” was published to google code. However, since then more profiling capability has been added to spf4j:
-
Improved Flame-graph visualization to better see hot-spots.
-
Request attributed profiling. The Spf4j Stack sampler has been integrated with the application ExecutionContexts enabling more granular profiling detail like described at
-
Aspects to monitor object allocation, network, file, memory, garbage collection usage have been added. One of the main advantages of spf4j is that it can be easily be used for continuous profiling. The captured profile data is persisted to ssdump files which can be opened and visualized with the spf4j UI.
Over time the Spf4j Stack sampler has been integrated with the application ExecutionContexts enabling more granular profiling detail like described at

When to profile your code?
I recommend to deploy your code with profiling turned on as much as you can. In my case I have profiling data collection turned on in all environments (including productiton) all the time.
Another good time to profile your code is during your JMH (http://openjdk.java.net/projects/code-tools/jmh/) benchmarks. A good practice is to have a benchmark module in your project, that will benchmark key functionality of your application. These benchmarks will be run as part of your build process, and you can monitor the performance of your project with a Jenkins JMH plugin
Your Unit tests are not immune to profiling either. With spf4j-junit you can also easily profile your unit tests with Spf4jRunListener.
How to profile your code
How to profile your java REST service.
If you are running a REST service, see a example at. running live at
For details on request attributed profiling see
For aggregated profiling see
Profiling a existing java application without code changes
Add spf4j to your classpath and the following to your command line:
${JAVA_HOME}/bin/java [your jvm args] org.spf4j.stackmonitor.Monitor -df [folder to write date] -dp [file prefix] -ss -si 100 -main [your app main class] -- [your app arguments]
This will start your application with profiling enabled, with a 100 ms sampling interval. After the process ends ssdump file will ge generated containing the profiling data. Profiling can also be enabled/disabled via JMX.
Supported arguments:
Usage:
 -df VAL   : dump folder (default: ./target)
 -di N     : the stack dump to file interval in milliseconds (default: 3600000)
 -dp VAL   : dump file prefix (default: ManagementFactory.getRuntimeMXBean().getName())
 -main VAL : the main class name
 -si N     : the stack sampling interval in milliseconds (default: 100)
 -ss       : start the stack sampling thread. (can also be done manually via
             jmx) (default: false)
Existing java application with code changes
You can also run and control the profiler via its java API:
    Sampler SAMPLER = new Sampler(SAMPLE_PERIOD_MSEC);
    SAMPLER.start();
    SAMPLER.stop();
    SampleNode collected = SAMPLER.getStackCollector().clear();
    Converter.saveToFile(fileName, collected);
Profile your JMH benchmarks
If you want to profile your JMH benchmarks you can simply add the spf4j JMH profiler to your startup options:
        Options opt = new OptionsBuilder()
                .include(".*")
                .addProfiler(JmhProfiler.class)
                .build();
         new Runner(opt).run();
The profiling measurements will be save to file into the current dir. They can be opened and analized with the spf4j-ui.
Spf4j contains also a JMH Profiler integration for Java Flight Recorder, to use it all you need to do is:
        Options opt = new OptionsBuilder()
                .include(".*")
                .addProfiler(JmhFlightRecorderProfiler.class)
                .build();
         new Runner(opt).run();
Java flight recorder should not have the safe point bias that spf4j has, however java flight recorder is a commercial feature that requires a license from Oracle for production use. For production use spf4j profiler is a zero cost alternative, which due to its simplicity should be a more reliable option as well.
THe Jmh integration is available in spf4j-jmh module:
        <dependency>
            <groupId>org.spf4j</groupId>
            <artifactId>spf4j-jmh</artifactId>
            <version>...</version>
            <scope>test</scope>
        </dependency>
How to see the profile data?
After the program finishes and during execution it will write the data to ssdump files.
If you are running with the REST actuator, you can visualize your data like in this live example. (see the “How to profile your java REST service” section for more detail.)
If you have a server application running and you started it with stack sampling, by default every 1 hour the collected stack data is dumped to the temp folder. You can also invoke Sampler.dumpToFile to dump the stack samples at any time in your program allowing you to separate out samples at relevant times in your application. You can load and visualize this data with the library embedded ui:
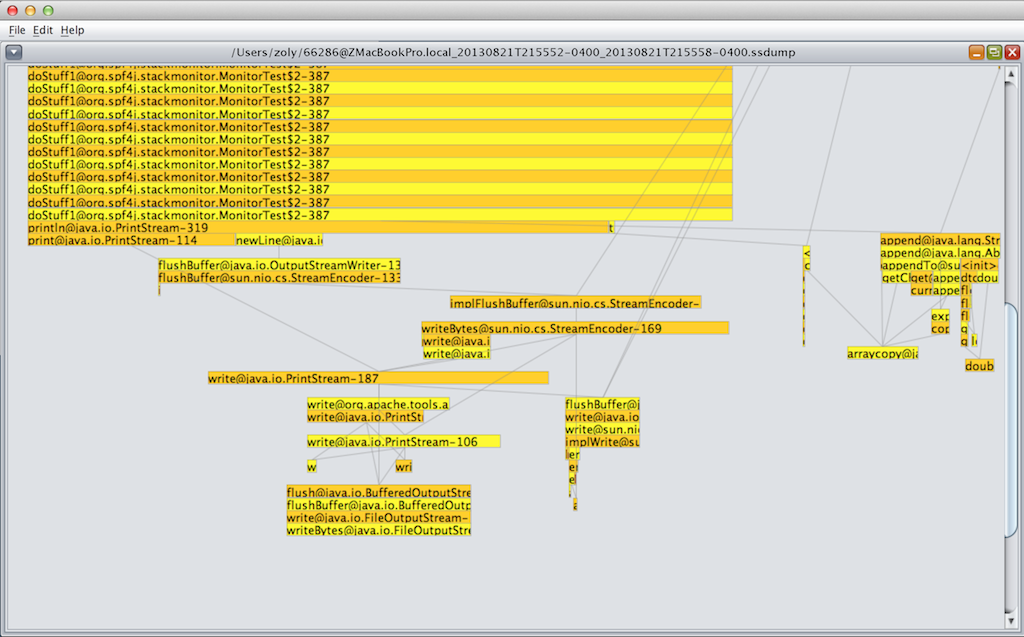
The classic flame graph visualization remains available. The explorer ui can be used to visualize the measurements stored in the tsdb files. You can also export the measurements to csv format allowing you to analyze them with tools like excel.
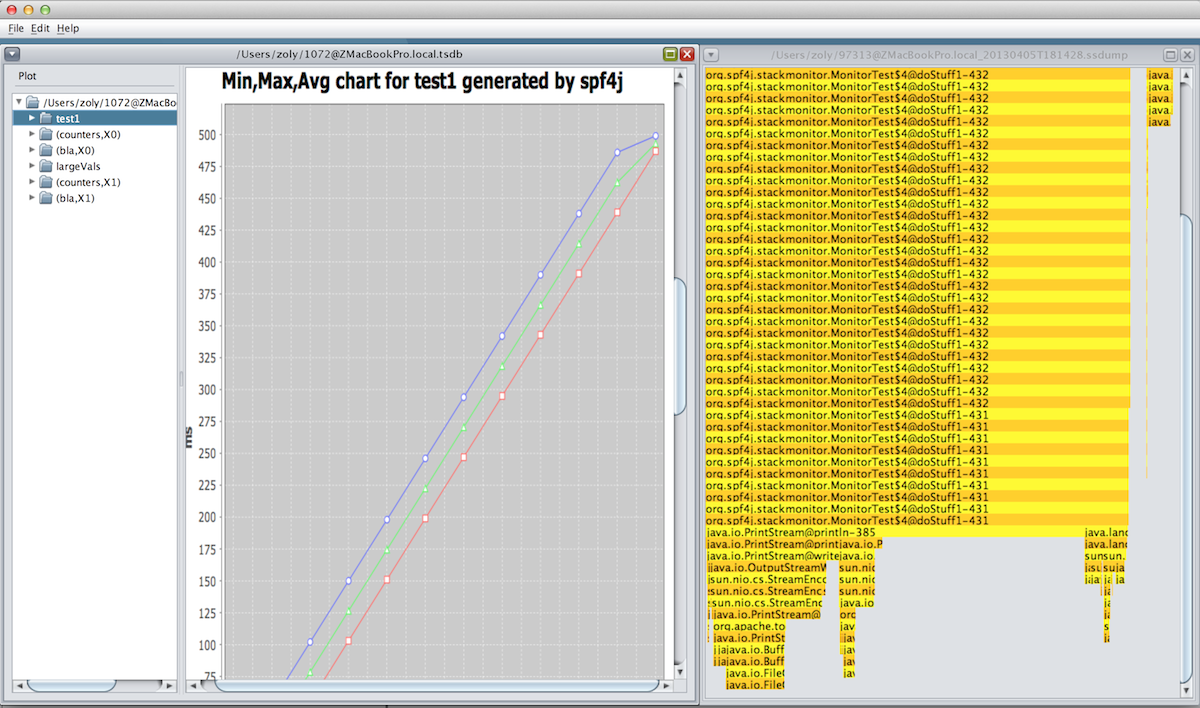
in the UI you can filter certain stack traces by right clicking on them and using the filter option in the context menu.
How does it work?
A sampling thread is started and running in the background. This thread uses Thread.getAllStackTraces() or the JVM MX beans (configurable) to get all stack traces for all threads. Each sample is added to a tree that aggregates the stack trace data.
Monitoring memory allocations:
You will need to apply aspect org.spf4j.memorymonitor.AllocationMonitorAspect to the code you want to monitor object allocations. This aspect will intercept all new objects calls in your code and it will use performance monitoring described at chapter 4 to record the number and amount of allocations. AspectJ load time weaving is not capable of intercepting allocations done inside rt.jar. You will have to apply your aspect against rt.jar and create a new one and add it to the boot class path in case you want to see all allocations.
Getting access to the data is same as described in chapter 4, you can do it over jmx, or opening the tsdb file in the embeded ui:
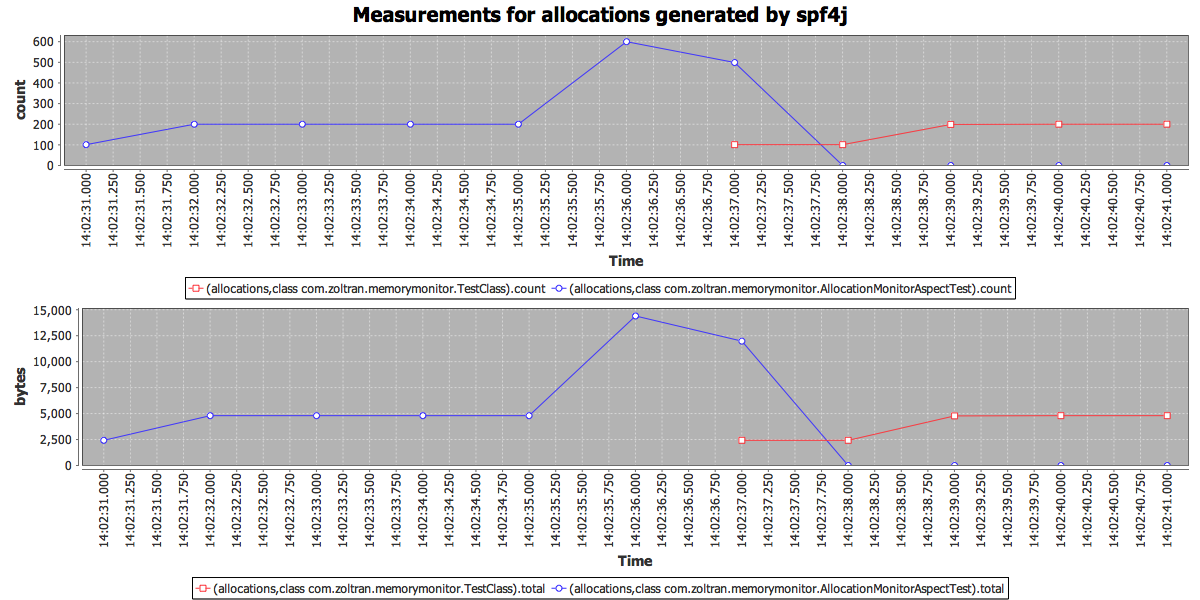
Allocations are classified based on the class where they are done. This allows you to quickly identify memory hogs. In the chart above you can see how memory allocations happened, both byteSize and allocation count and what class. Object size computation might be too much overhead, in that case you can disable it by system property setting:
-Dperf.allocations.recordSize=false
Monitoring Network IO
The aspect org.spf4j.iomonitor.NetworkMonitorAspect will allow you to monitor you processes network traffic.
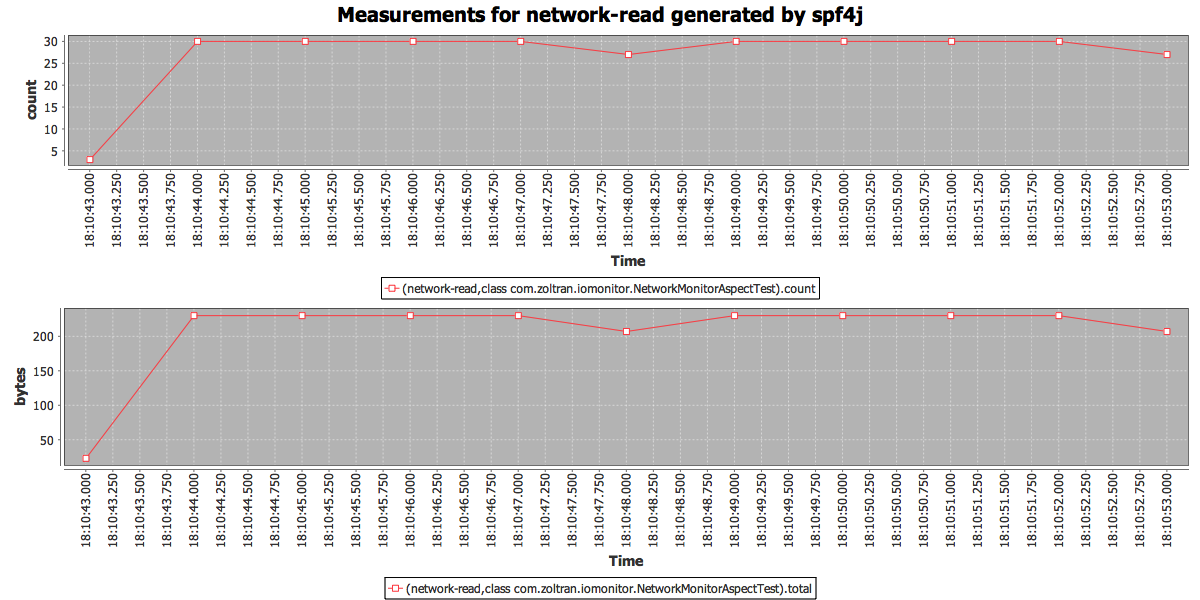 network traffic
Monitoring Memory Usage
By calling MemoryUsageSampler.startMemoryUsageSampling(sampleTime) memory usage will be sampled at the provided interval. Sampled data ill be aggregated at the interval set by perf.memory.sampleAggMillis system property. Data will be stored into a spf4j tsdb where data can be accessed via jmx or the sf4j ui.
Monitoring File Usage
By calling OpenFilesSampler.startFileUsageSampling(sampleTime, warnThreshold, errorThreshold), file usage will be sampled at the provided interval. This is usefull to see open files trend and detect file handle leaks, which will cause in general outages of your application. The warn and error threshold numbers will long details provided by lsof to help you troubleshoot what is going on. Sampled data will be aggregated at the interval set by perf.io.openFiles.sampleAggMillis system property. Data will be stored into a spf4j tsdb where data can be accessed via jmx or the sf4j ui.
Notes
Due to the use of Thread.getStackTraces() the profile data is safe point biased, which is an important aspect to consider when analyzing your profile results. For more detail on safepoint bias see:
Evaluating the accuracy of Java profilers
Honest profiler also see