
Metrics
Overview
To reduce the observer effect Thread Local Counters are being used along with a optimized avro based binary file format.
This is how it works:

See for measurement types supported.
How to record measurements
Via API
- Low impact with log linear quantized recording for Gauge type of measurements:
private static final MeasurementRecorder recorder
                     = RecorderFactory.createScalableQuantizedRecorder(forWhat, unitOfMeasurement,
                     sampleTime, factor, lowerMagnitude, higherMagnitude, quantasPerMagnitude);
…
recorder.record(measurement);
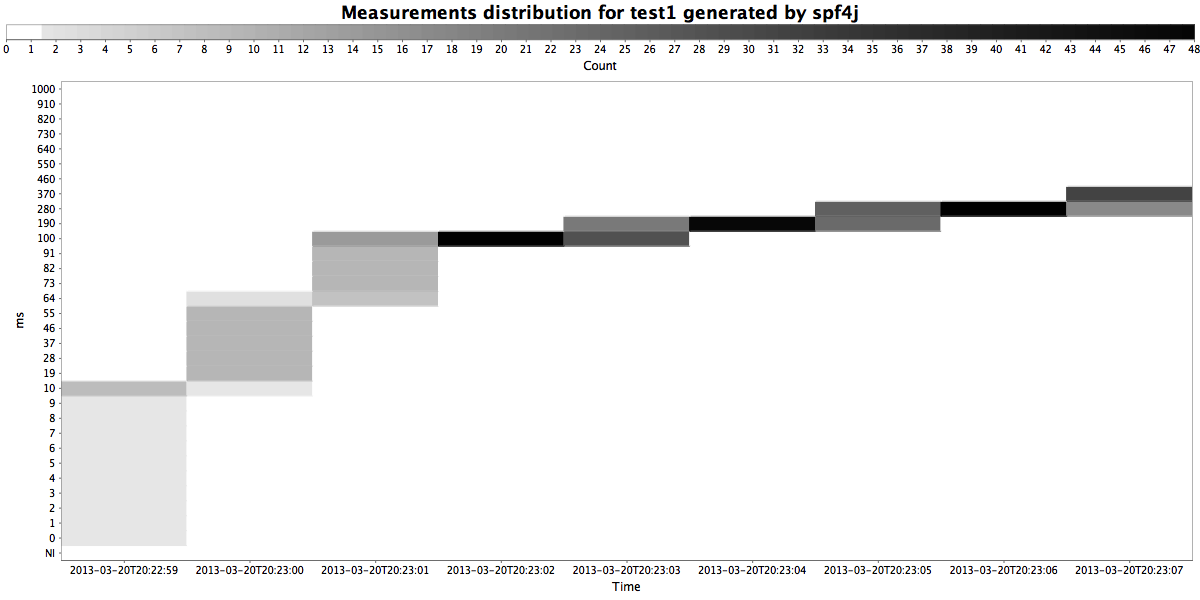
This is ideal for recording execution times and provides the most detail. (Min, max, avg, and detailed distribution heat chart) If distribution chart is not needed createScalableMinMaxAvgRecorder is available with less overhead.
- Low impact with simple counting for Counters.
private static final MeasurementRecorder recorder
                     = RecorderFactory.createScalableCountingRecorder(forWhat, unitOfMeasurement, sampleTimeMillis);
…
recorder.record(measurement);
This is ideal for measurements like bytesSent, bytesReceived.
- Dynamic with log linear quantized recording for Gauge type of measurements.
private static final MeasurementRecorderSource recorderSource
                    = RecorderFactory.createScalableQuantizedRecorderSource( forWhatCategory, unitOfMeasurement,
                      sampleTime, factor, lowerMagnitude, higherMagnitude, quantasPerMagnitude);
…
recorderSource.getRecorder(forWhat).record(measurement)
As with the low impact static recorders there are dynamic equivalents:
createScalableMinMaxAvgRecorderSource and createScalableCountingRecorderSource
You can also create a monitored callable and call it of pass it to a executor like :
Callable<?> monitoredCallable =
     performanceMonitoredCallable(recorderSource, warnMillis, errorMillis, callable, "myCallable").call()
Via Annotations
Annotate a method you want to measure and monitor performance with the annotation:
@PerformanceMonitor(warnThresholdMillis=1, errorThresholdMillis=100, recorderSource = RecorderSourceInstance.Rs5m.class)
Start your jvm with Aspectj(1.7.x if you use java 1.7 or 1.8.x if you use java 1.8) load time weaver:
-javaagent:${project.build.directory}/lib/aspectjweaver-${aspectj.version}.jar
Make sure your aspectj config file (META-INF/aop.xml) contains:
<aspectj>
<aspects>
<aspect name="org.spf4j.perf.aspects.PerformanceMonitorAspect"/>
</aspects>
<weaver options="-verbose">
    <!-- make sure the classes you want to apply aspects to are included -->
    <include within="com..*"/>
    <include within="org.spf4j.perf.aspects.PerformanceMonitorAspect"/>
</weaver>
</aspectj>
This will record the execution times of the annotated method, and will also log (via spf4j) a message containing the call detail and execution time if the warn or error thresholds are exceeded. Dynamic quantized recorder source is used.
Where are measurements stored?
You can configure where the measurements are stored via the “spf4j.perf.ms.config” system property like:
-Dspf4j.perf.ms.config=TSDB@/path/to/file.tsdb,TSDB_TXT@/path/to/file.tsdbtxt,GRAPHITE_UDP@1.1.1.1:8080,GRAPHITE_TCP@1.1.1.1:8080
TSDB_AVRO (DEFAULT) - standard avro files, metrics will be stored to *.tabledef.avro (metadata) and *.observation.avro (obsevations)
TSDB - binary file format (this is the most efficient store)
TSDB_TXT - text format each line: groupname, timestamp millis, sampletime millis, measurementName1, measurementValue2, …
GRAPHITE_UDP - Graphite UDP appender.
GRAPHITE_TCP - Graphite UDP appender.
How to see the recorded measurements?
REST actuator /metrics
This endpoint allows you to get to:
You can get the metrics in any format you might need:
You can also query your metrics more precisely:
- Get the metrics for the last hour.
- Get the metrics for the last 10 hours
- Get the metrics for the last 10 hours aggregated hourly
Via JMX
invoke org.spf4j.perf.impl.ms.tsdb.TSDBMeasurementStore/flush to flush all measurements from memory to disk.
invoke org.spf4j.perf.impl.ms.tsdb.TSDBMeasurementStore/getTableAsCsv to get the data from a particular tsdb table as csv.
invoke org.spf4j.perf.impl.ms.tsdb.TSDBMeasurementStore/writeTableAsCsv to write the data from a particular rsdb table to a csv file.
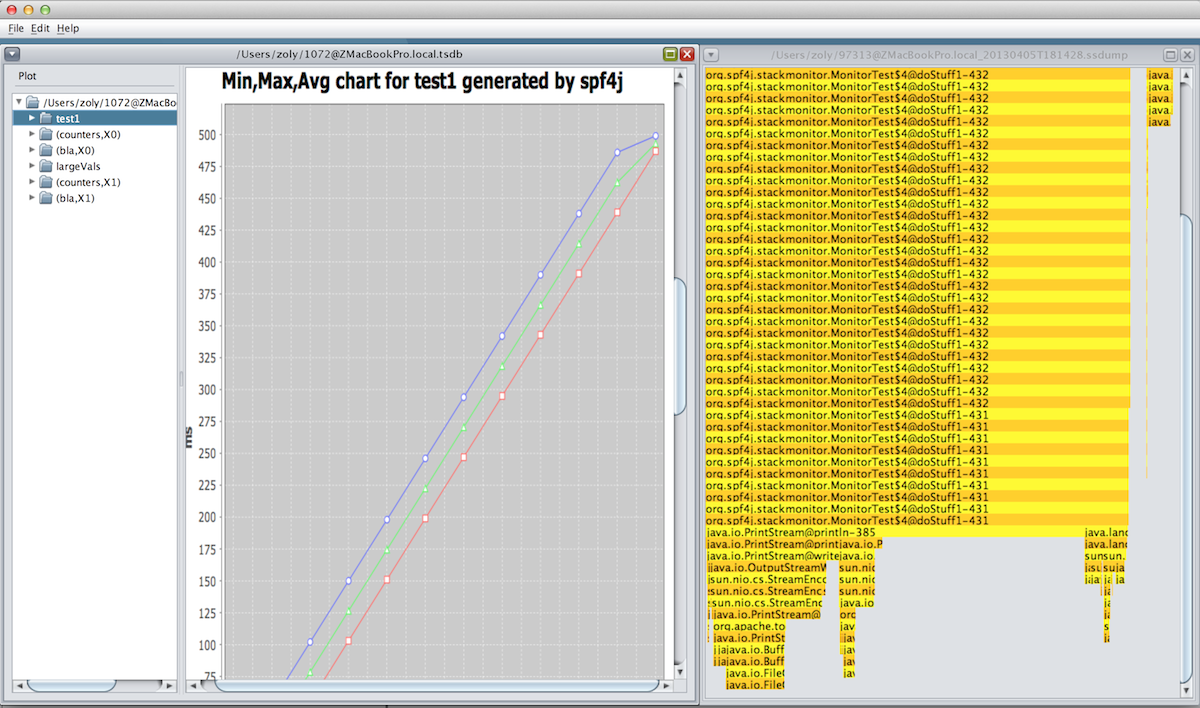
spf4j-ui
The recorded measurements are saved to a TSDB file. Use the library provided UI (spf4j-ui module) to open the file and visualize the measurements.
JMX support
You can annotate with @JmxExport getters and setters of a attribute or any other method that you want to make available via JMX. Here is what you need to do:
    public static final class JmxTest {

        private volatile String stringVal;

        @JmxExport
        public String getStringVal() {
            return stringVal;
        }

        @JmxExport
        public void setStringVal(final String stringVal) {
            this.stringVal = stringVal;
        }

        private static volatile String testStr;

        @JmxExport
        public static String getTestStr() {
            return testStr;
        }

        public static void setTestStr(final String testStr) {
            JmxTest2.testStr = testStr;
        }

    }
...
        // Create object
        JmxTest testObj = new JmxTest();
        // Expose object via JMX (JmxExport annotated methods)
        Registry.export("test", "Test", testObj);